Statistical analysis - Naive Bayes spam filter (python)
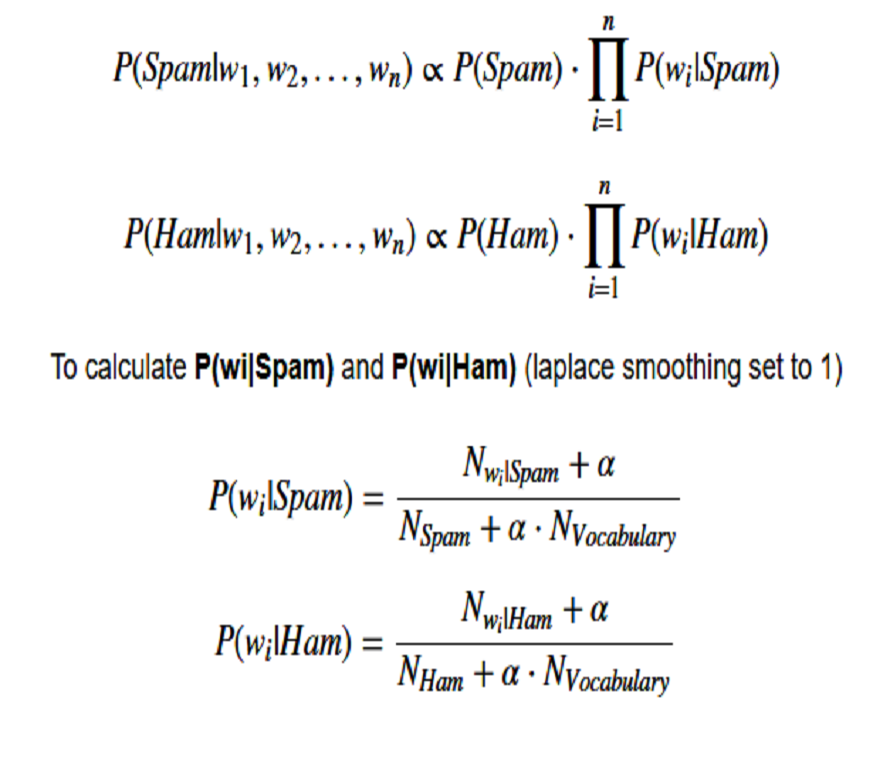
Building a messaging spam filter using a Naive Bayes algorithm, training and test data.


I started my python journey learning how to visualise, clean and present data. Nowadays as an analyst, python is more of an automation tool, writing scripts to automate the ingestion of data, whereas the visualisation is mostly left to Tableau. Therefore, the following notebooks either represent the work before starting my career in data, or data science projects i've done out of interest.
Building a messaging spam filter using a Naive Bayes algorithm, training and test data.
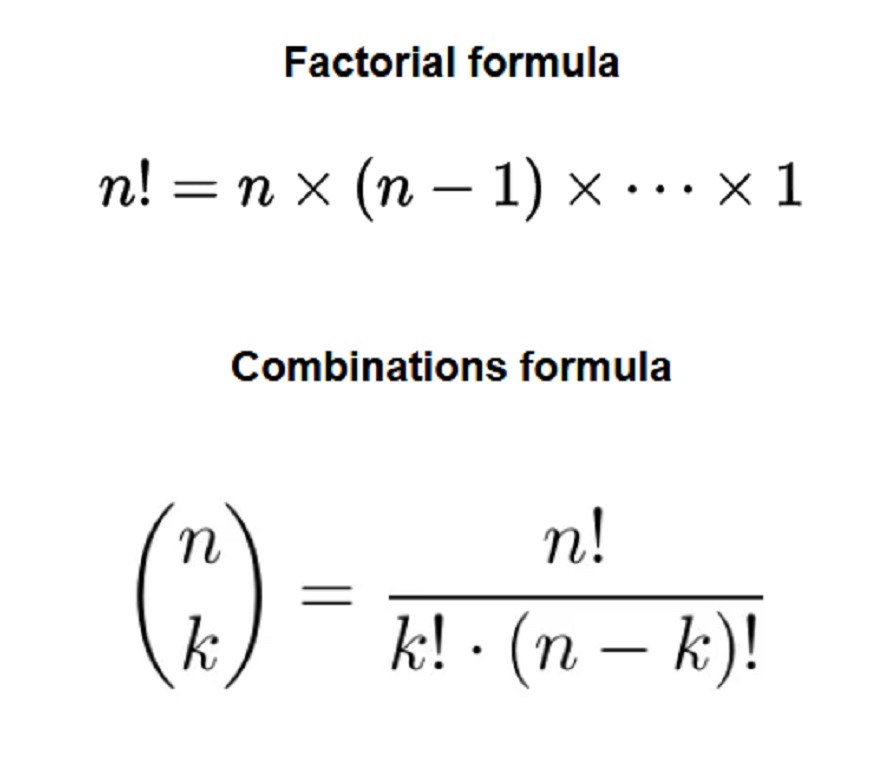
Calculating probabilities in order to build some of the logic for an app designed to help lottery addicts.
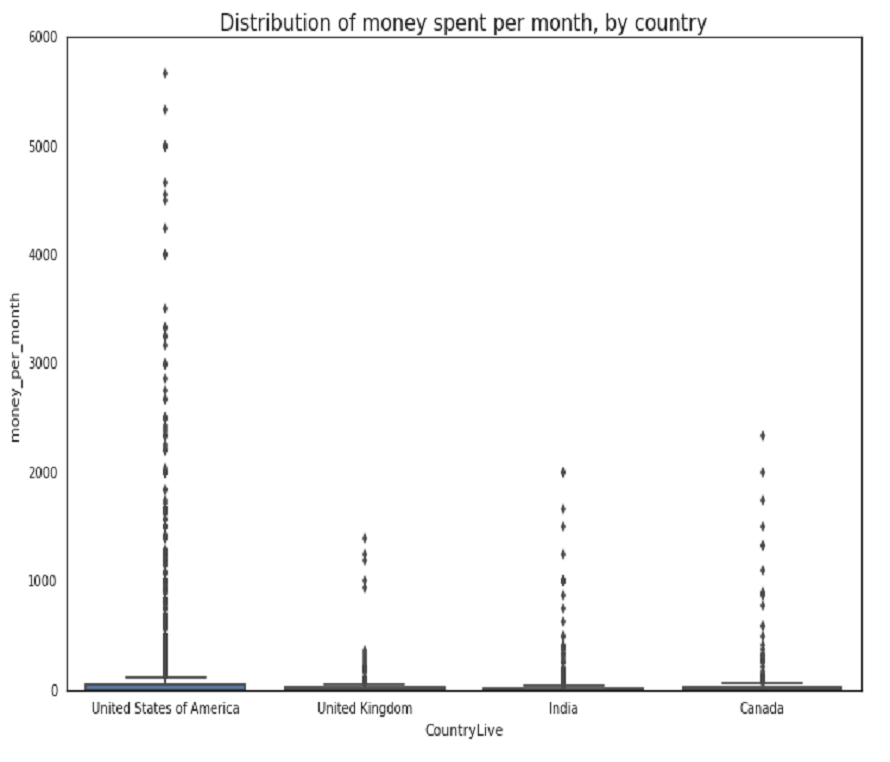
Examining the best markets for an E-learning company to advertise in, based upon average spend by location and language preferences. As part of the analysis, I visualise the distribution and identify outliers that may impact the data.
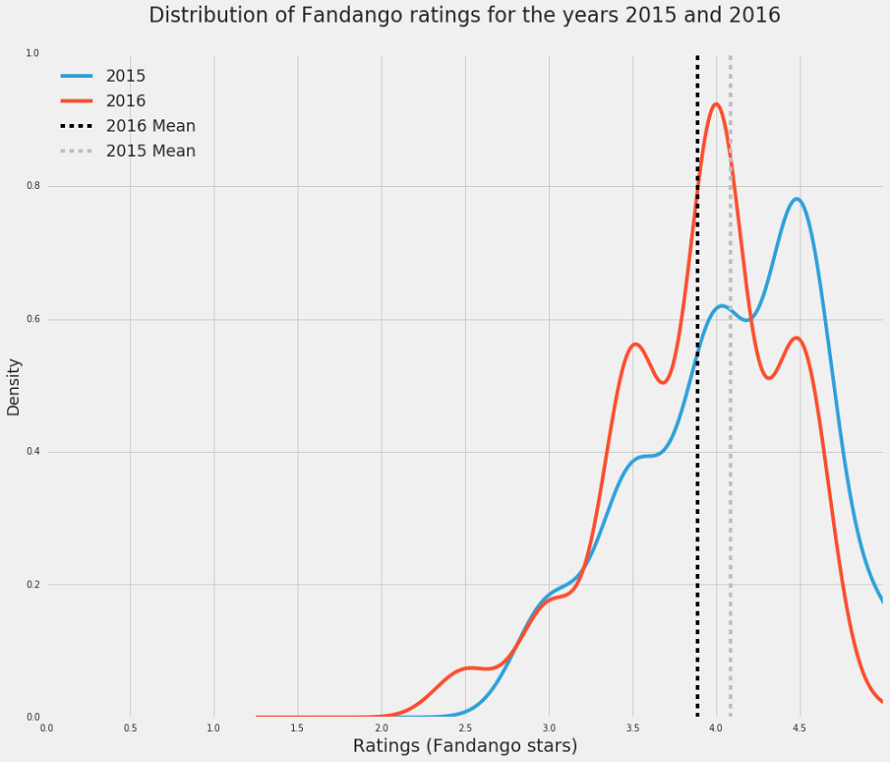
Based on a piece of popular data analysis from 2015, I explore Fandango's movie ratings by comparing two samples of popular movies from different years for inconsistencies in ratings. I use kernel density estimate (KDE) plots and create some summary statistics of my findings.

Inferring popular data science topics from StackExchange's data science posts. Seaborn heat maps and other visuals, tracking interest of topics over time, public data base querying.
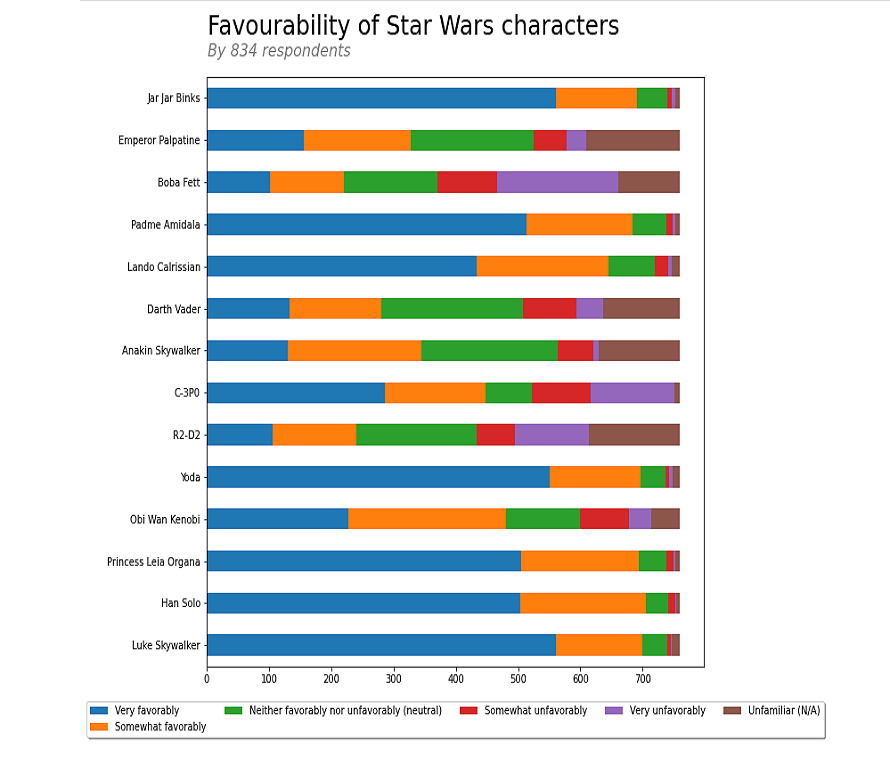
Just a short data cleaning walthrough, based on data collected by the team over at FiveThirtyEight regarding public opinion on the best Star Wars film. This was a good dataset to work with for data cleaning practice, as multiple answers were allowed for some of the questions.
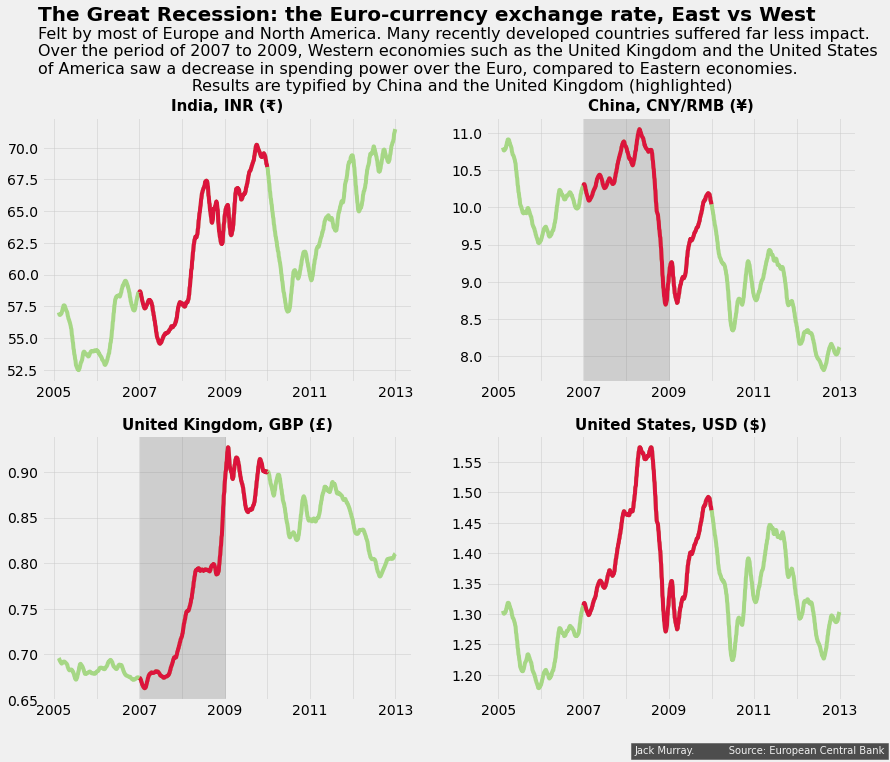
Putting into practice how to use information design principles such as data-ink ratios to create an engaging graph for a more general audience, using pandas and matplotlib.

A complete data-cleaning walkthrough for multiple datasets concerning American SAT scores in New York City (NYC).
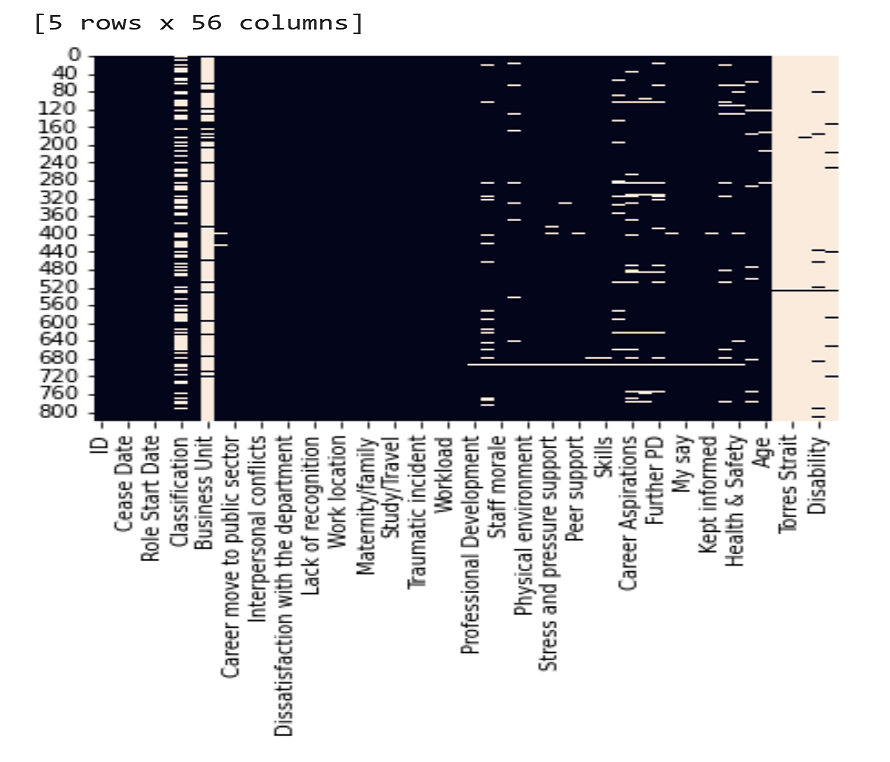
Exit survey results from employees of the Department of Education, Training and Employment (DETE), and Technical and Further Education (TAFE) institute in Queensland, Australia. Aiming to demonstrate some data cleaning techniques and working with some missing data.
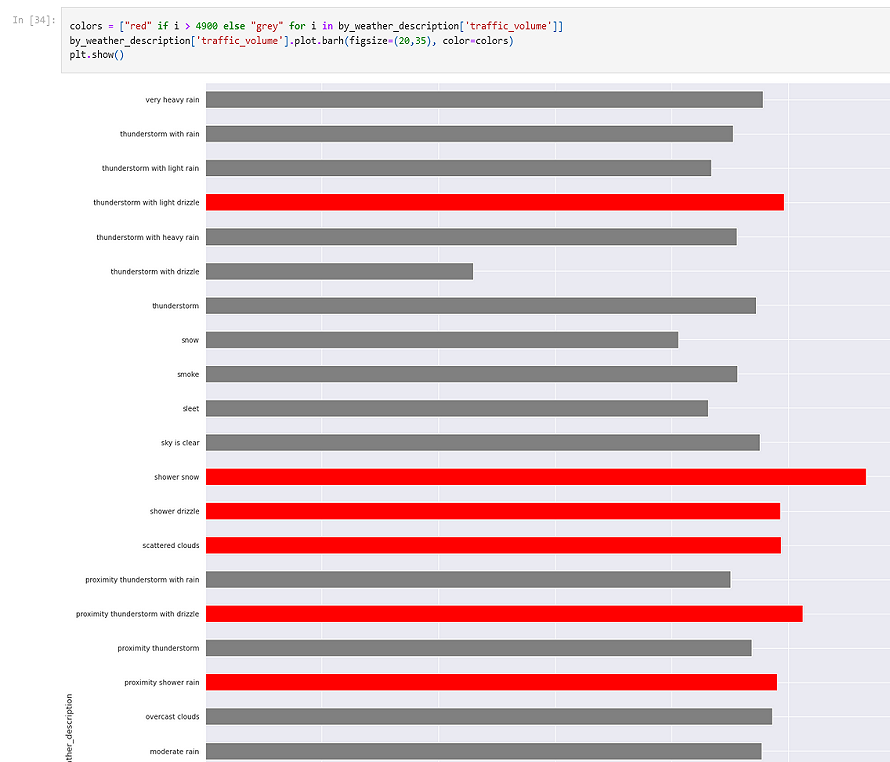
Analysing a dataset about traffic conditions on an American interstate highway, to determine some indicators of heavy traffic.
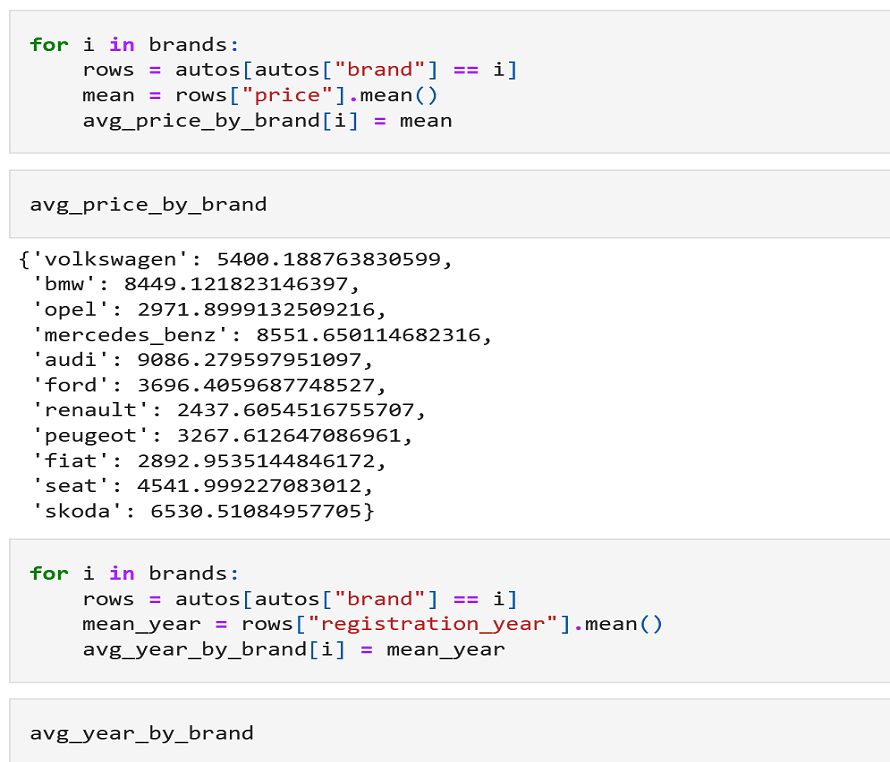
First attempt at using NumPy and Pandas for a project (have used them subsequently and frequently). This dataset consists of used car listings on German eBay. The aim is to clean and analyse the data.
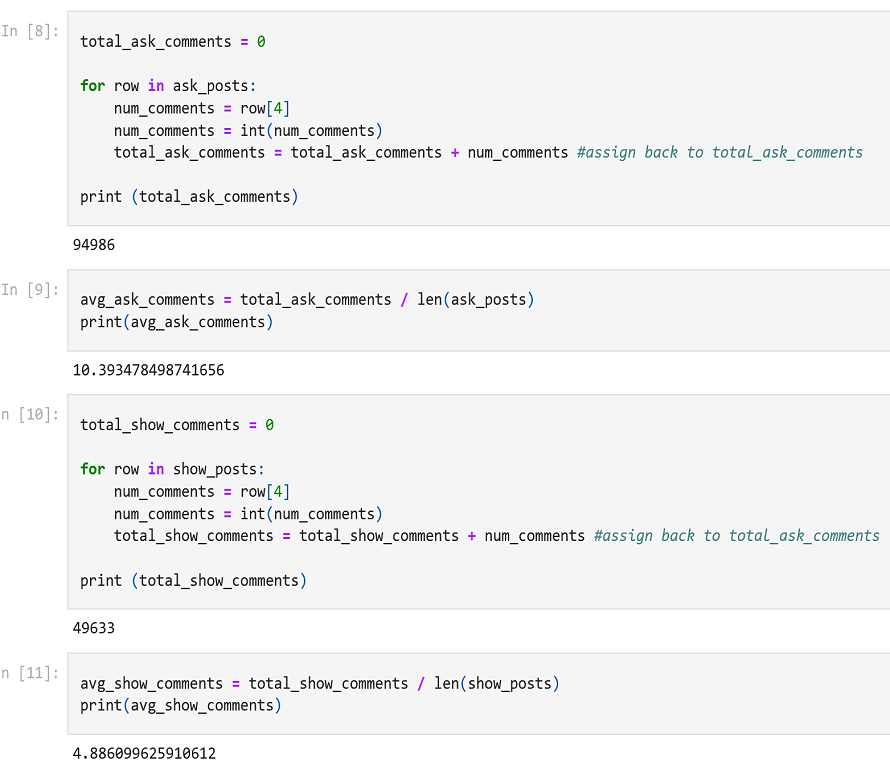
This was my second ever project, no libraries used. Baby steps, part 2.
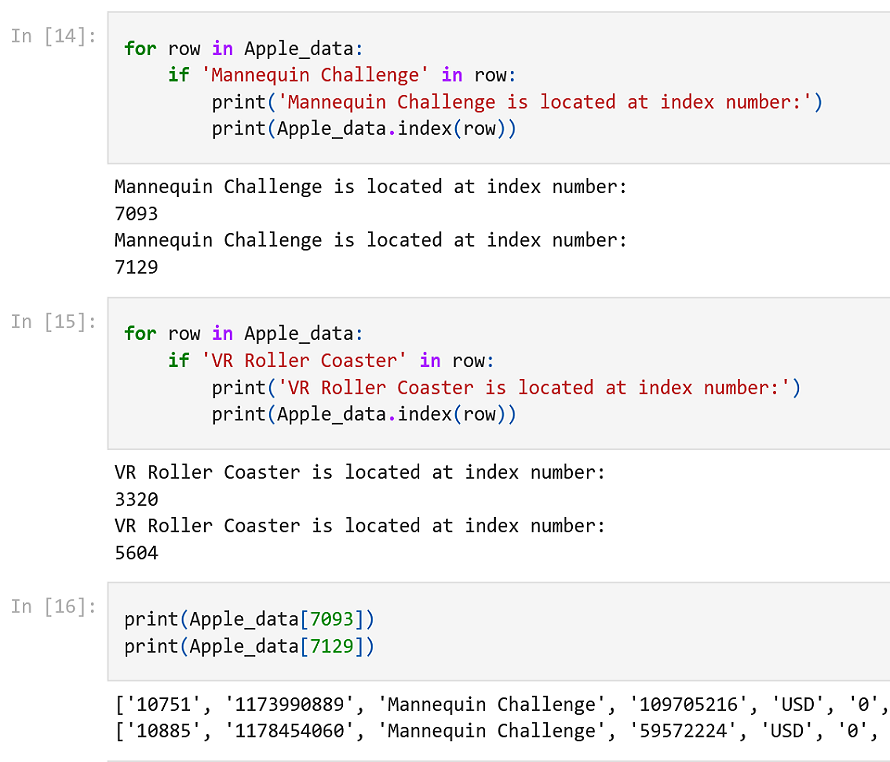
This was my first ever project, no libraries used. The scenario used is from the perspective of a data analyst at a company that makes free apps. The data has to be analysed to help developers make their next product.
Applying probability concepts such as Bayes' theorem to build an algorithm to classify messages as spam or non-spam.
Using python to investigate popular data science topics, using post data from StackExchange. Seaborn visuals, tracking interest over time, public database querying!
If you'd like to get in contact with me, please see below. I welcome any feedback and I can provide CVs for interested recruiters.